NPS (22) – How to almost do customer research (AppDynamics) – 22nd article in the series on NPS
Welcome to the 22nd post in my extensive series on NPS and the Net Promoter System. In the last two articles I discussed the major mistakes made by British Airways, Audi and others. This time I cover a company that almost gets it right. Unfortunately their results seem to be a sort of ‘vanity metric’ without a robust source.
A company with industry-leading NPS performance and a customer-centric culture can ruin their message by exaggerating, providing misleading information, and ‘comparing apples with oranges’. When you are performing well, there is no need for such communication. What follows is an example of an over-enthusiastic marketing department using an internal NPS result to (presumably not intentionally) misinform customers. It provides a wonderful example of messaging that gets ahead of the actual facts.
The press release
AppDynamics is a company that provides software for managing computer systems. They have recently been acquired by Cisco. Unfortunately, they have become masters of misleading communication about NPS scores. They have repeatedly published silly press releases that discredit their excellent performance and have the potential to discredit the Net Promoter System. In an early example in September 2015, they led with this headline:
AppDynamics Continues With Category-Leading Net Promoter Score of 85 for the First Half of Fiscal Year 2016
More than 500 customers weigh in to confirm positive experience with Application Intelligence Platform
They go on to say:
AppDynamics, a leading application intelligence company, today announced that it achieved a Net Promoter Score, or NPS® Score, of 85 for the first six months of its fiscal year beginning February 1, 2015. AppDynamics has maintained an NPS score over 80 for each successive six month period over the last three fiscal years, demonstrating its leadership among enterprise software companies, which on average earn NPS scores of mid-twenties according to Satmetrix.
And follow that by:
According to a benchmark study from the Temkin Group, scores for the overall software category in 2014 range from the low teens to the mid-40s. Companies with NPS scores of 60+ are generally considered top performers; USAA (insurance and financial services) and JetBlue are on this elite list, as is Apple. Enterprise software companies have typically had average scores below 20.
So, what is wrong with this?
Here are the main defects:
- They do not provide any information about the source of the score of 85, though it is implied that it comes from an internal initiative called the Customer 360 program. No other company appears to be covered by that program, so it is not a competitive benchmark.
- They mention the respected Temkin benchmarks without mentioning that Temkin do not include AppDynamics in their data.
- Strangely, they were already well above average for the software industry with scores in the low 40s at the time, according to a double-blind benchmark studies by IPSOS and Qualtrics that I used at HP. The same studies also show IBM, CA, HP and BMC between 40 and 50 for Business Service Management software. The average score for IT management software overall is 38, with 8,800 customer responses. 175 people responded for AppDynamics. VMware was leading at 59.
- While software industry benchmark scores have improved markedly since September 2015, 85 was not a credible benchmark score at that time. No company on the planet had ever had a score of 85 in any double-blind benchmark survey in any industry by the end of 2015. I have personally validated the methodology Qualtrics uses with Bain and it corresponds to their views on how double-blind benchmarking should be done. I shared the benchmark scores with various competitors before I retired from HP in early 2016. We discussed the AppDynamics press releases too. Some competitors had commissioned their own benchmark surveys, and found similar results to what I mention for AppDynamics. Nobody found scores higher than 45 at the time.
The software industry has been improving, and here in 2019 it has become more credible that such high scores are possible. I have no doubt that the Customer 360 program is making a difference. My former colleagues tell me that AppDynamics has produced the highest benchmark scores seen so far. They and their competitors have all improved. It will be interesting to see how this trends.
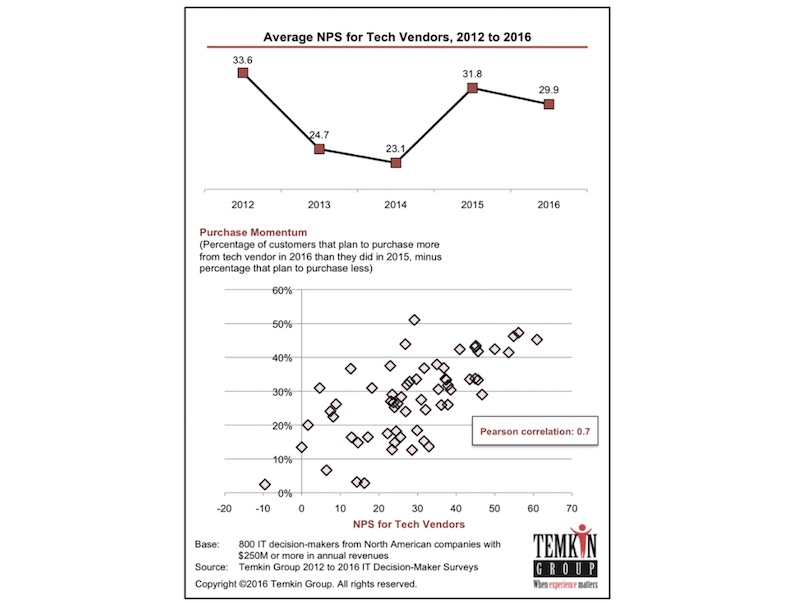
Temkin benchmarks
For the sake of completeness, the illustration below shows the Temkin NPS technology industry benchmarks for 2016, the time of the press release shown above. 62 vendors are covered, almost all of them software vendors. Even without the intermediate points on the table, you will quickly see that the AppDynamics statement that “Enterprise software companies have typically had average scores below 20” is simply not true. Note that most Temkin reports are free of charge, ever since Qualtrics acquired Temkin Group in 2018. Of course the AppDynamics statement could be based on yet another unattributed source.
Conclusion
When they had great performance, the sort of press release, website content and sales material AppDynamics used in 2015 did it a disservice. Don’t publish scores from your own company surveys and represent them as objective benchmark comparisons. Your competitors know the numbers are wrong and many can easily provide your customers with correct data. The correction may call into question other claims you have made about your products or services. If an NPS number appears to be too good to be true, it is!
If you persuade your senior management that the comparison is fair and real, you also put your future work at risk. After all, your mission seems to have been accomplished. The work should now be put into business-as-usual mode and the investment scaled back. As it is, AppDynamics was on a path to market leadership, though perhaps not at quite the speed their communications people believed in late 2015. Perhaps this is why Cisco acquired them in early 2017. Finally, note that in the spirit of fairness, I wrote to the person whose name was on the press release to make these points, and he did not reply.
Next time
The next article will be the first of two on the heart of the Net Promoter System: the feedback, learning, and improvement processes. The process has three elements: the Inner Loop, the Outer Loop, and the Huddle.
As is often the case, the above is a slightly-edited version of a chapter in one of our books; in this case Net Promoter – Implement the System All of our books are available in paperback and Kindle formats from Amazon stores worldwide, and from your better book retailers.