How to evaluate customer survey text analysis software
Customer research of all types can be divided into two categories: rating questions and open questions. You are dealing with rating questions when you are asked to provide a numerical answer to each question, against a rating scale of some sort. Typically the questions correspond to what the company doing the research believes is important. The list is generated without asking customers what they think is important. Rating surveys can be useful for measuring your own internal departments, but are not very useful for driving improvements. After all, you have not asked the customer why they gave the particular rating. This is where open questions, like ‘Why?’ come in.
The main challenge of the open text response format is the need to analyze what people have written, ideally without any human bias. I would like to cover some general principles about using text analytics software. The overall intent is to provide you a way of comparing and selecting software for your own use. There is no single universally-correct answer. Your answer will depend on factors like volumes, languages and budgets, among others.
General principles about text analysis software
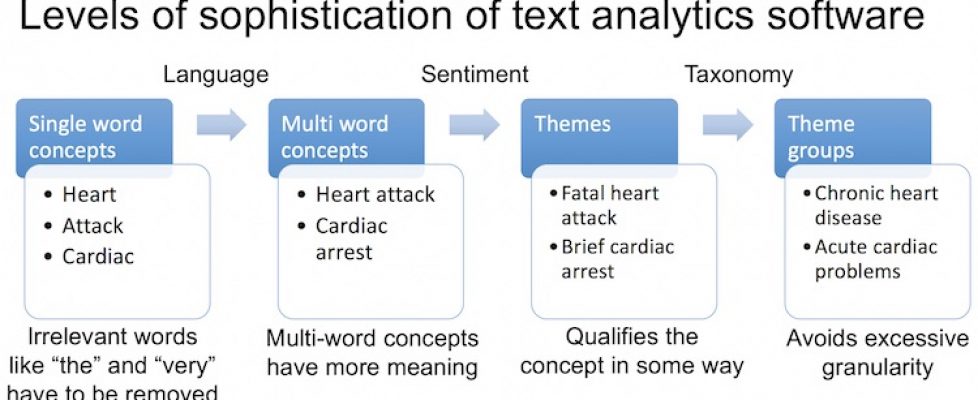
Here is what I believe text mining and analysis software has to be able to do, with increasing levels of difficulty as summarized in the diagram at the top of this post. Software should be graded in each area:
- Accept inputs in a variety of formats such as Excel, SurveyMonkey, SalesForce, .csv, video and audio files and so on. The more the better.
- Recognize inputs in a variety of languages. Again, the more the better.
- Identify concepts in a meaningful way. There are four levels:
- The first is simple word frequency, with no filtering. Words like ‘the’ or ‘very’ could come up.
- The second recognizes nouns and discards articles and conjunctions. ‘Heart’ and ‘Attack’ would be separate topics at this level.
- The third level is multi-word topics, such as ‘Heart Attack’ or ‘Cardiac Arrest’.
- Finally, words that mean the same thing need to be grouped into a single concept. For example, “support website” and “support webpage.” This avoids long lists of concepts.
- Identify sentiment to determine whether respondents refer to a concept in a positive, negative or neutral way. Sentiment analysis determines which attributes a customer associates with the concept.
- Identify themes by combining concepts with sentiment and/or linguistic analysis. ‘Fatal heart attack’ or ‘Disgusting undercooked food’ might be themes. ‘Bad food’ is a different theme to ‘good food’. This last example illustrates why simple word frequency software is not useful for survey analytics. Just getting the word ‘food’ a lot will not tell a restaurant owner much.
- Group similar themes to avoid excessive granularity. ‘Serious heart attack’ and ‘Major cardiac arrest’ are grouped together in this step. It may involve use of industry-specific libraries or taxonomies. Some software is delivered with such libraries or lets you add your own. Other programs use data-driven approaches to determine similar words based on how your customers use them in a sentence. Google, for example, uses data-driven Natural Language Processing to make sense of your search queries.
- Finally, my experimentation so far has shown that correct handling of pronouns turns out to be very difficult indeed for software, remaining easy for humans.
Overall objective of any survey analysis process
Unless you are only interested in tracking a metric, for example to reward people, the fundamental purpose of any survey analysis is to find out what your top improvement priorities should be. The winner of any comparison should therefore be the process or tool that answers that question. The advantage of software over humans is that the only bias is that caused by the programmers. I admit that such bias can be considerable, particularly when selecting the algorithms to be used to categorize text.
A hard historic lesson on decision criteria
In all scientific experiments, it is critical to set up the methodology before you have any data. This was made very evident by changes in US rules on drug approvals. Experimenters are required to provide details of the exact methodology and data analysis process before they start the clinical trials. The results have been dramatic. If you go back 40 years to when researchers could decide how to run the analysis after they had the data, over half the trials were successful. Now the success rate is just under 10%, as people cannot remove data or change their analysis after the fact because the results do not suit them.
The seven-country study farce that affects our lives today
The most famous study that suffered from post-hoc adjustments was the legendary and highly influential ‘Seven countries study’ by Ancel Keys on the relationship between diet and heart disease by country. The study was done in 1958 and continued for 50 years. It showed a directly linear relationship between saturated fat consumption and heart disease. In 2009, Robert Lustig found that Keys had cherry-picked the seven countries from a data set that included either 21 or 22 countries. He apparently discarded the data from the 15 countries that did not support his theory. A separate piece of work also showed that Keys’ results could be better explained by differences in sugar consumption, which Keys had not studied. There is a nasty history of scientists who took positions opposing Keys losing their research funding and even their jobs.
Conclusion
These are just some guidelines that will help your selection process. Text analysis is difficult to do well, and the software for doing it is evolving quickly. I suggest including the items above among your selection criteria. Above all, decide on your selection criteria before testing the software, to avoid bias.
As always, your comments and suggestions are welcome below. There is a lot more on this subject in our book on the Net Promoter System.


