NPS (19) – How to calculate the lifetime value of a customer – 19th article in the series on NPS
While you can find many methods of doing the calculation on the web, there is only one correct answer. The value of a customer to your company is the total cash flow they generate for you over their entire lifetime. The single calculation method for this is Discounted Cash Flow; the Net Present Value of all cash flows out into the future. No other method is correct, though there are some acceptable approximations. The theory and experience of NPS practitioners is that the operating profit per customer is highest for Promoters and lowest for Detractors. Do not confuse revenue and operating profit. You can have customers that generate lots of revenue, but even more cost. They have negative lifetime cash flow, unless you can turn them around.
The main problem you will face
Unfortunately, most companies are not able to calculate profitability by customer. Financial reporting usually works by product line, not by customer. Asking your finance person to provide you an accurate cash flow from each of your top 100 customers individually will probably be a waste of time. Businesses that depend on large contracts are an exception, and you may well be able to calculate the cash flow from each contract.
Suggested method
In the absence of accurate standard reporting, a good starting point is to work with your finance person to calculate a ‘proxy P&L’ for each of your different customer categories. Unfortunately, there are accepted accounting standards for many things, but not for the precise methods used to calculate the lifetime value of a customer. Segmenting customers in a useful way is a critical step. The first distinction to be made is between customers who have an ongoing contractual relationship with your company, and those who buy things, but have no contractual relationship. The former category is easy to work with. Past contract renewal rates can be used to determine future expectations. Direct Marketing principles need to be applied to the latter category. Direct Marketers think in terms of ‘RFM’: Recency, Frequency, and Monetary value.
Other customer segmentations that are useful will depend on your business model. If you sell both direct and via resellers, lifetime value expectations will be different. They will also differ between very large customers who depend on your company to run their business, and others. If you have the data, NPS categories can be used to refine renewal rate expectations. Here are examples of what needs to be used in the calculation:
- List prices.
- Contra-revenue, meaning discounts you give from the list price. While large customers tend to attract higher ‘standard’ discounts, you will generally have easier discount negotiations with Promoters than with Detractors. Since contra-revenue is not part of any standard P&L, it is often forgotten.
- Net revenue, meaning list price less contra-revenue.
- Cost of Goods Sold. This includes costs of ‘free’ replacement items and additional merchandise that you may have to supply Detractors to help turn them around. If you have a dedicated escalations team, you can easily calculate the average cost per escalation and use that to assign a total escalation labor cost. While ‘Cost of Goods Sold’ sounds like it should include the cost of selling and marketing, it does not. Selling, General and Administrative costs are ‘below the line’, which means they are not counted in the Gross Margin calculation, but are considered when calculating operating profit.
- Where Detractors or Passives leave you sooner than Promoters, you can assign a cost of attracting a new customer. Many sales teams are split into ‘Hunters’ who go after new customers and ‘Farmers’ who develop deeper relationships over time and are measured on retention and additional business for existing customers. Farmers generally cost about a quarter of the Hunter cost per revenue dollar. If you don’t split your sales teams this way, agree a reasonable rule of thumb with your finance partner while you try to measure it more accurately. Marketing costs can be split that way too.
- If you happen to have any indication that you get some of your new customers by referrals from your happiest existing customers, it is worth agreeing a way of taking this into account. However, if you already have a strong enough differentiation between Promoters, Passives and Detractors for your purposes, I suggest this simply be listed as an additional factor that you have not yet quantified. Attaching a reliable number to it can be tricky.
- Beware of the law of small numbers. If the most positive and negative numbers come from unusually small groups in your analysis, you should find a way of combining them with a larger group until you can validate the reality of what you have seen.
If you are not able to get to this level of detail, calculating expected lifetime revenue per customer is a lot better than doing nothing.
If you can only work on one thing for a contract business
If all this is too sophisticated for the time you have available, here is the single area you should focus on, if your business depends on annual contracts. Just agree the value of a one-percent improvement in contract renewal rates. It is easy to calculate, and you probably have the data on past renewal rates. If you work in a large company, you have de facto experiments in place. By this I mean you can simply observe different measurable business practices or levels of customer-centric performance that have happened by accident, rather than by design. Look at how they have affected renewal rates. If you seem to have nothing relevant, test new practices in part of your company and compare renewal rates. You can test multiple things simultaneously, provided you keep a control group, where nothing has changed. Improved renewal rates were how we justified Customer Success teams at HP Software. These teams worked with customers, free of charge, to make sure they were using software effectively and achieving the benefits they expected.
Summary
Compared to the others, Promoters stay with you longer, buy more products, escalate less, are less price sensitive and are less expensive to sell to and service. There are many businesses that have marginal overall profitability. If you have customers that have been generating negative margins for some time, you will have to decide whether you can turn them around or whether you should drop them as clients. Clarity is more important than always getting the answers you would most like to hear. Once you have agreed the lifetime values of the different NPS customer categories, you and your CFO (or delegate) should present it together to your leadership team for approval. Even if you are not able to do it right away, it should be part of your formal NPS implementation plan. Your credibility depends on it. Your company’s long-term commitment to NPS also depends on it.
Looking forward
The next article in the series will be a counter-example, meaning an example of what you should not do when conducting customer research. The first one will be from British Airways.
Learning check
Here are some true / false questions to check whether I have been successful in communicating my main messages in the last few blog posts. The answers are at the bottom of the page.
- The cost of renewing an existing contract is typically one-tenth the cost of acquiring a new customer.
- If your overall brand NPS trend is better than that of your competitors, it is safe to assume that all parts of your business will benefit in the same way.
- Bain experience suggests that the average time lag between a relative NPS improvement and new product revenue improvement is 6 to 18 months.
- Since contra-revenue is not in a standard P&L statement, it should not be considered when calculating the lifetime value of a customer.
- To avoid bias, all customers should be considered equal in your research, no matter how much they spend with you or your competition.
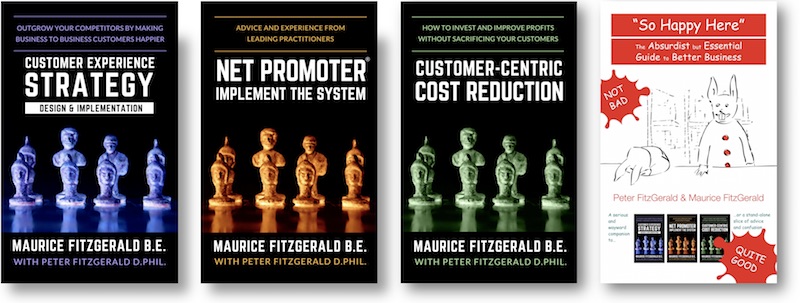
As is often the case, the above is a slightly-edited version of a chapter in one of our books; in this case Net Promoter – Implement the System All of our books are available in paperback and Kindle formats from Amazon stores worldwide, and from your better book retailers.
Answers to the learning check questions:
- True: Renewing a contract is mainly an administrative effort and costs far less than hunting for and acquiring a new customer.
- False: You need to do the analysis for each part of your business for which you produce a P&L.
- True: This is to do with the average purchase cycle. Even if they love you, people are relatively unlikely to buy the same thing again right away. This varies widely by type of product.
- False: Promoters tend to get lower discounts than less happy customers and discounts from list prices are not in your P&L in most accounting systems.
- False: You need to distinguish between customers who spend a lot and those who don’t spend much on your type of product or service when calculating lifetime value. Large spenders tend to be more demanding than small spenders, and therefore tend to give lower NPS scores.


