NPS (18) – Relationship between NPS trends and revenue / market share – 18th in the series on NPS
This is the 18th article in a series on the Net Promoter Score and Net Promoter System. The subject this time is a critical one: the relationship between NPS trends and revenue. The topic has been somewhat controversial over the years, though I am not entirely sure why.
If you work for a for-profit organization, every activity should contribute to your operating profit. If you personally have no credible background in finance, your company Chief Financial Officer is critical to your success. There are two main areas where you must be aligned: proving the relationship between NPS trends and revenue trends and calculating the lifetime value of a customer.
Relationship between NPS and growth
You should ask your CFO to assign a person to work with you to validate the relationship between NPS and growth (or decline) in market share. Expect to propose the methodology and ask that person to assist with the data; both your own and that from your competitors. Organization changes and M&A can make comparisons difficult and a Finance person will be well-equipped to read and understand relevant P&L statements. Assuming you are basing the comparison on NPS data from a reliable benchmark provider, there should be no major difficulty with the analysis. It is natural that you will be able to segment your own data better than that of competitors. NPS trends usually, but not always, predict market share trends. In Bain’s experience, NPS trends explain and predict between 20 and 60% of market share trends. While NPS trends are an important growth predictor, they are of course not the only thing that matters. You or a competitor might get distracted by a merger with another company, for example, and that might counteract any NPS gain. There are also types of businesses for which NPS does not provide any predictive value. An example follows.
Calculating the relationship between NPS and growth
The only reliable basis for calculating the relationship between NPS and growth is a well-executed double-blind benchmark survey. The reason no other survey type provides a reliable data source is because no other research gives you unbiased data on your competitors. Imagine a situation where you only have a single competitor, and you know nothing about their NPS trend. Your own score moves from 22 to 35 over three years. You pat yourself on the back and assume increased market share will follow. Maybe. If your competitor has improved from 10 to 32 over the same period, they will probably take share from you. The thing that matters in the relationship between revenue and NPS is your trend compared to your main competitor’s trend. If you are in a highly-fragmented market it is OK to compare yourself to the overall average.
Use cubic regression
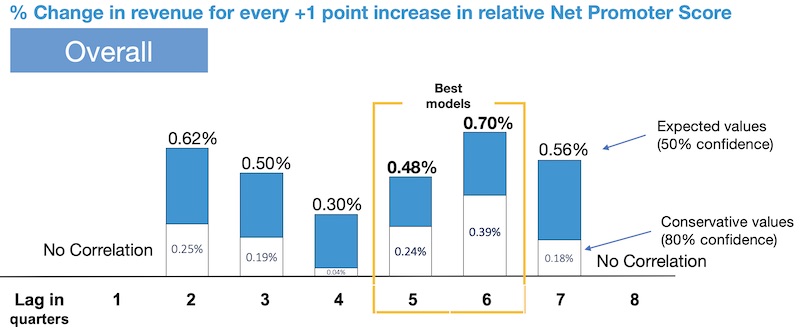
Since you will not have a huge number of data points for your analysis, cubic regression will usually provide a better data fit than linear regression, quadratic regression or simple correlation. All are easy to test in Excel. Assuming there is a relationship between relative NPS and revenue, a good rule of thumb is that cubic regression will show it to be about twice as strong as a linear fit. An advantage of using multiple regression (rather than correlation), is that you can test the relationship between other factors like an economic recession or GDP changes within your overall model. You can get surprises. The graphs in the following paragraphs show the relationship between relative Net Promoter Score and growth for one HP business, as measured over a period of eight years. The absolute numbers have been modified somewhat from the confidential data, and the trend indications are accurate. We got 20,000 competitive benchmark survey responses per year.
Analyzing subsets of a business
Within an overall business, you can and should examine trends for subsets. In one HP Software business, we looked at the effect of NPS trends on license sales, professional services sales, and remedial support contracts. While we found the results somewhat surprising, they do agree with what Fred Reichheld and Rob Markey have found over the years, namely that NPS tends to have little or no predictive value for support / service center types of businesses. My interpretation of this lack of predictive value is that NPS can’t predict revenue trends for ‘hygiene factor’ businesses. These are the businesses that can anger customers but have no real ability to delight them. Let’s discuss each of the three businesses in turn. The first graph shows the results for the overall business. Note that these numbers are not the actual confidential HP numbers, but are all notionally correct.
Licenses
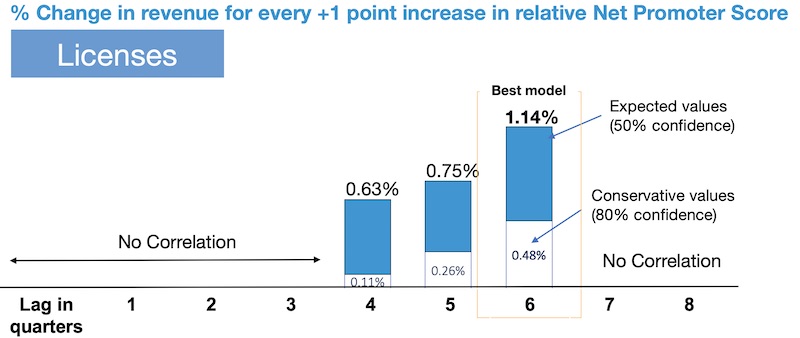
Product purchased follow a life cycle. Customers buy things, and if they are happy they will buy more after some time. In Bain’s experience, the average time lag between a movement in NPS relative to competition and a corresponding movement in product sales is about 18 months. This graph shows approximately what it was like for a major HP software business:
Professional services
Consulting services include training, installation services and other services associated with using software as effectively as possible. The services are not proprietary, which means customers have alternatives. The effect of this is that changes in NPS produce changes in professional services revenue more quickly and more durably than for product licenses, as can be seen in this graph:

Support
Reichheld and Markey have long held that the recommendation question is not a good predictor for most support services, meaning services where the perceived value is the ability to call on someone to help you with a product when you have a problem. They don’t discuss why. I believe it is because the work of service centers is a hygiene factor. Once it is good enough, there is no real benefit to making it great. The recommendation question works best for products and services that can truly be great. This is what the data showed for HP Software support services, backing up that point. There is no significant correlation between overall software brand NPS scores and software support revenue. Businesses that only or mainly do service center work would be an exception. The non-relationship applies to businesses where the support center exists to do just that, answer questions about a product or service after it has been sold. Personally, I suggest using Customer Effort Score for research about support services.
Looking forward
The next article in the series will be on how to calculate the lifetime value of a customer.
As is often the case, the above is a slightly-edited version of a chapter in one of our books; in this case Net Promoter – Implement the System All of our books are available in paperback and Kindle formats from Amazon stores worldwide, and from your better book retailers.