The Outer Loop of the Net Promoter System® (5-minute read)
The Outer Loop is where generic, systematic improvement opportunities get addressed. There are two types of Outer Loop activities:
- The first are those that can be addressed within a single team or function. For example, if your French customers consistently tell you they do not want service center people to use their first names when speaking to them, that can be addressed within the service center.
- The second category of improvement work is that which requires collaboration across different businesses and functions. If your customers tell you that you need to be able to deliver products within 24 hours, when your current minimum is a week, different parts of the company will need to work together to make the improvement. This is the core work of the overall company customer experience leader.
Prioritizing Outer Loop work
The essence of any business strategy is the concentration of your scarce resources on just a few things that really matter and help you to beat your competitors. When one initiative is complete, start a new one. For the cross-functional work, I recommend having three to five initiatives, no more. It will make the work relatively easy to communicate and to resource, and the team will see regular progress. The (separate) mono-functional teams should have the same limit. A business or function does not necessarily have to have an improvement initiative. You should not waste resources on things that customers don’t care about.
Useful sources of data for Outer Loop work
Here are the sources of data that are most useful for Outer Loop work:
- If you have it, the competitive NPS benchmark data should be the most important source. While it might seem subtle, the purpose of your work is not continuous improvement of everything; rather it is the improvement of a few things that make the biggest difference competitively, whether to catch up, or to provide differentiation.
- Relationship feedback data is generally the second-most important source to use. If your target customer base is a small number of large companies, it may be all you need.
- Opportunities that the Inner Loop process has not been able to address are in third place. The reason they are not at the top of the list is that they need to be prioritized in a broader context. While it may seem odd, there will be things a lot of customers would like you to improve but where there is no real benefit in doing so, compared to other potential actions.
- Operational data is necessary to establish the current state of things customers complain about. For example, your customers may complain about long delivery times for products, and your operational data may confirm that the most popular product was out of stock for two weeks, but it is available now. You may decide to discuss how that situation can be avoided in the future, or may just decide that it was a one-off event. Personally, I totally failed to fix one of these situations at HP, despite trying hard for years. Our manufacturing plants for servers shut down for a week at the end of each calendar year. The order management systems continued to provide customers with estimated delivery dates that did not take the shutdown into account. I tried to get this changed for four years in a row, without success. I believe the root cause of my failure was a corporate function that was being measured by these committed dates, rather than actual shipment dates. And don’t get me started on a metric where the ‘shipment date’ was the day something was put into a shipping container, rather than the day the shipping container actually left.
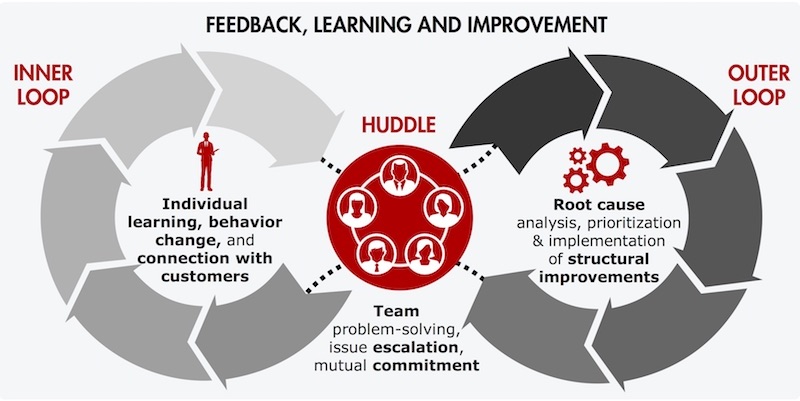
Managing improvements — the Huddle
The primary vehicle for the selection and ongoing management of improvement initiatives is the Huddle. The main mono-function Huddles should be weekly or more often, and can be very brief. The majority of their discussions and work need to be on things team members can do on their own. You can complement these by longer meetings on a less-frequent basis. Cross-functional Huddles are harder to coordinate and should be planned as monthly events. The same cross-functional team can have a longer session twice a year to work on the overall customer experience strategy.
Typical agenda for mono-functional Huddle
Like any other meeting, there needs to be an agenda and people need to prepare for it in advance. Here is a reasonable starting point:
9:00 Welcome — John
9:05 Check status of items on Huddle action tracker — Paul
9:10 New feedback from transactional surveys — George
9:20 Status update on Order TAT initiative — Ringo
9:25 Any Other Business and Close
Fifteen minutes can be plenty for a huddle too.
A great method for prioritizing work
Jim Dixon of Bain has published a great methodology[1] for prioritizing improvement work. It finally addresses the challenge of making customer journey mapping into something truly useful. Journey Mapping is a popular customer experience technique. Its main disadvantage is that it considers every customer touchpoint as equal. It also fails to distinguish between hygiene factors and things that give you a competitive advantage. Jim’s work solves both problems.
Hygiene factors
A hygiene factor is something like taking a shower: nobody cares if you have one, but everyone will notice if you don’t have one for a long time. Think about a real-world example: you don’t think about data security when using online banking. You would not recommend your bank because they did not leak all your personal information and passwords. However, you would certainly be very unhappy if they did.
Jim Dixon takes this into account by considering each touchpoint in terms of its relative ability to delight or to anger customers. The source for this information should be customer comments on the open questions in your feedback system. If Detractors say that long waiting times are the top reason for them being a Detractor, and Promoters never mention waiting times, waiting times only have the potential to anger, and are a hygiene factor. To an extent, this logic is built into the best of the customer journey systems. What Jim adds is competitive benchmarking. This gives you a way of visualizing and taking account of areas where your competitors have an advantage, as proven by your research. Here is the way to combine it all into a single chart. The diagram below is from Jim Dixon’s work.
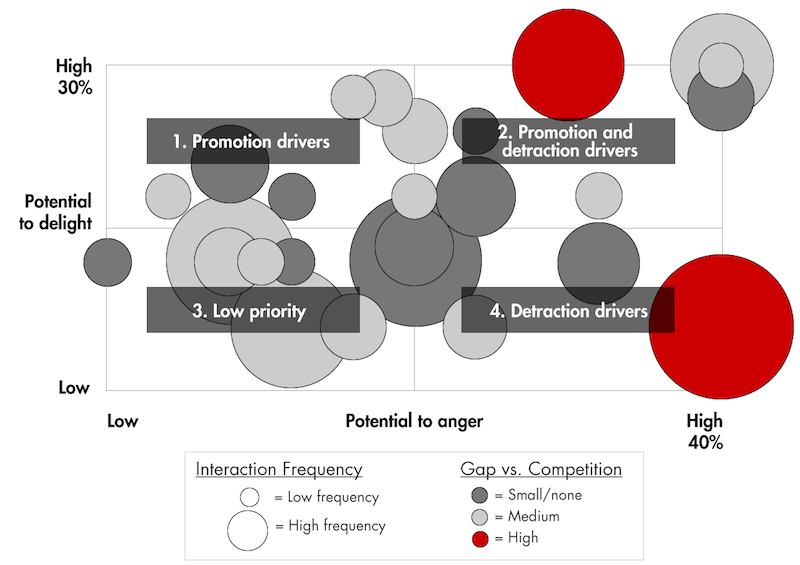
Use in a Huddle
If an Outer Loop team were considering the graph to prioritize improvement work, the two red circles would take top place. This example does not have any green circles, which would be areas where you have a competitive advantage you may want to push even further. You would probably avoid taking any action on items in the bottom-left box, as your customers don’t care about them. Existing ‘bottom-left’ improvement work can and should be wound up to provide resources to work on the new priority areas. This process should be used to establish the initial ‘long list’. A further step is needed to get to the final short list.
Prioritizing initiatives
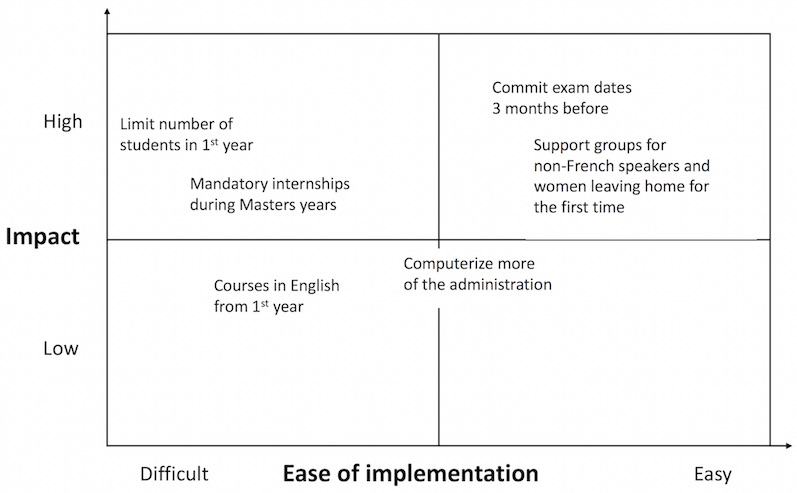
The graph below is a simple diagram that will help you to prioritize improvement initiatives based on impact and ease of implementation. In the example below, you would get to work on the ones in the top-right box right away. This one was used to prioritize actions after collecting feedback from Swiss business school students.

[1] You can read the Bain description here:
http://www.netpromotersystem.com/resources/toolkit/interaction-prioritization.aspx
(The image at the top of the article is copyright Bain & Company. Used with permission. Net Promoter, Net Promoter System, Net Promoter Score, NPS and the NPS-related emoticons are registered trademarks of Bain & Company, Inc., Fred Reichheld and Satmetrix Systems, Inc.)
As is usually the case, this post is an edited version of a chapter in one of our books; in this case Net Promoter – Implement the System. Like all of our books, it is available in print and Kindle formats from Amazon.

