NPS (14) – 14th in the series – Customer survey response rates and statistical significance
Welcome to the 14th article in my series about NPS and the Net Promoter System. This time I cover response rates, sample sizes and statistical significance. Perhaps the most important points are about how to communicate such technical concepts. (Hint: Don’t!)
All survey types are sensitive to response rates. The lower your response rate, the less accurate your survey. Bain analysis shows that surveys with low response rates give over-optimistic results, as the people who like you tend to respond more easily than those who do not. Getting high response rates is primarily a function of the nature of the relationship you have with the people you are surveying. If you are using email to try to survey people you have never met, and with whom you have never done business, you should expect a response rate of 3% or less. At the other extreme, if you have a practice of formally interviewing ten executives from your largest client face-to-face every six months, have been doing so for the last five years, demonstrating that you provide the improvements they request, a 100% response rate is a reasonable expectation.
Perverse effect of high response rates
High response rates drive lower scores on a constant scale. In my experience with HP, this meant that our deep face-to-face relationship surveys with 80%+ response rates usually produced Net Promoter Scores that were considerably lower than the scores we saw in benchmark surveys or indeed in any other type of survey. Avoid the temptation to compare scores from different types of survey, or at least from surveys with very different response rates.
Here is what Reichheld and Markey say
My own experience is not an isolated case and others have found similar trends. Based on their many years of experience, Fred and Rob provide some numbers, and I believe the numbers should surprise most people. They show a far greater impact of low response rates than expected. I don’t believe the phenomenon is specific to NPS. The principles should apply to all rating systems. Let’s suppose you have carried out a survey and the results are as shown below.
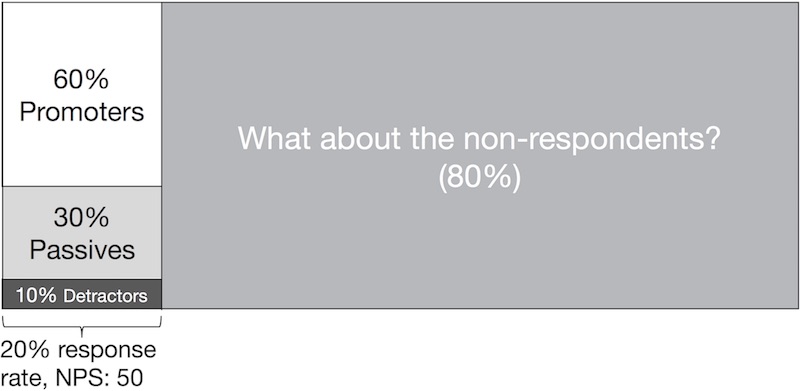
The question is, what do the people on the right think? The diagram below is what is shown in The Ultimate Question 2.0. It represents what would have happened had 100% of the recipients responded to your survey.
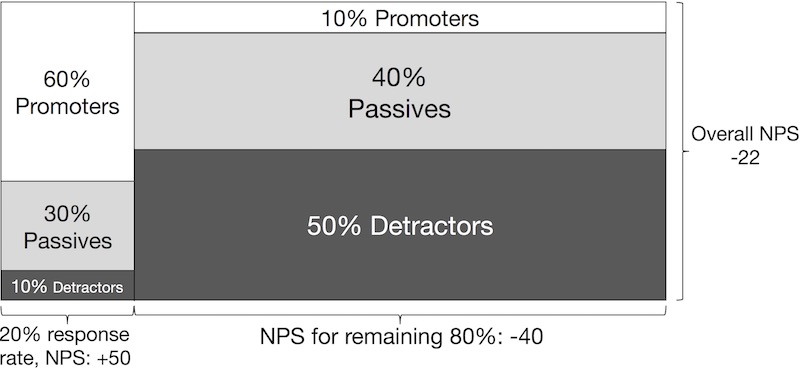
The theory is that Promoters are the ones most likely to answer your surveys. They like you and want to help. Passives and Detractors are more likely to think you have already wasted enough of their time. Extreme Detractors will still tend to answer. In a conversation with Rob Markey I asked him how they had determined the numbers on the right. He said it was done by observing the actual behaviors of the non-respondents in a large number of studies in a variety of industries.
Surprise!
This surprises most people. It is a very difficult subject to study as you can’t simultaneously get different response rates for the same survey and same audience. What I have seen is that the results from people who take the survey when they receive a follow-up email tend to be lower than for the initial respondents, though I have also seen exceptions. My brother (and this book’s illustrator) has a doctorate in Cognitive Psychology and has not been able to design an experiment that would prove the theory. Nonetheless, the psychology suggested by Fred and Rob makes sense to me. (Feel free to accuse me of cognitive bias!)
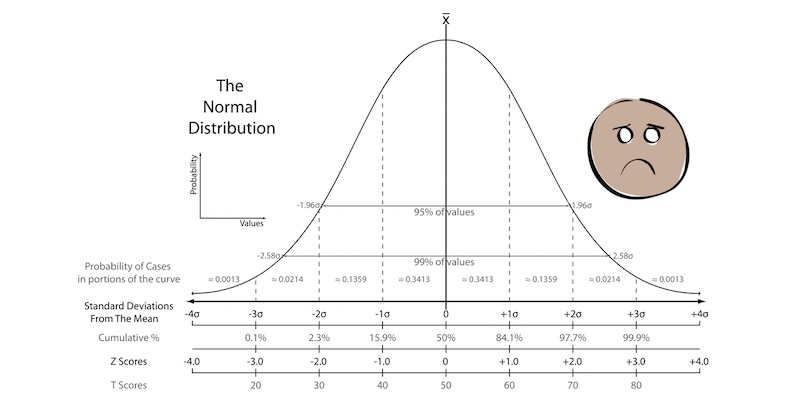
Statistical significance
Analysis and determination of statistical significance of results can be challenging. The following statement may seem counter-intuitive: If you want people to trust your metrics, don’t include any information about statistical significance in your main communication vehicles. There are two main reasons for this:
- There is no single way to explain significance across all feedback systems. Correctly explaining the significance for each type of survey is long and complex and will make people believe you are manipulating the numbers.
- There are survey types where intuitive significance rules do not apply. For example, if you have 20 customers that represent 60% of your revenue and you have high-quality relationship survey results from 15 of them, you are in great shape. If you try to explain the statistical significance range correctly, some amateur statistician in your audience is bound to say, “There are less than 30 companies in your sample so it can’t possibly be significant.” If you don’t mention significance, there will be fewer opportunities for such people to embarrass themselves. If the question is asked, well, good luck, and be diplomatic.
Improving response rates
Next, let’s look at the key techniques for improving response rates:
- Application of classical direct marketing practices.
- Use of technology when email is used to send survey invitations.
- Work on the quality of your contact list.
Looking forward
Next time I will cover the use of classical direct marketing techniques to improve response rates.
As is often the case, the above is a slightly-edited version of a chapter in one of our books; in this case Net Promoter – Implement the System All of our books are available in paperback and Kindle formats from Amazon stores worldwide, and from your better book retailers.