
NPS (32) – Employee Net Promoter Score (eNPS) – 32nd article in a series on the Net Promoter System®
Welcome to the 32nd article in my series on the Net Promoter Score and System. This time the subject is a variation on the Net Promoter Score: the Employee Net Promoter Score or NPS. Bain revised the initial concept just under two years ago so some of what follows may be new to you.
You can read all of the prior articles in the NPS series on our blog page here.
What is eNPS?
Most medium and large companies, NGOs and public sector organizations measure employee happiness in a structured way, on a regular basis. The purpose of such research is usually to help executives to understand what the general employee population would like them to improve. The CEO also gets to find out what improvements the executives would like to see. Almost everyone uses excessively complex survey methods that take too long and provide limited information about improvement suggestions. Applying the Net Promoter System solves these problems.
Darci Darnell of Bain announced Net Promoter for People in a Bain Net Promoter System podcast on November 30th, 2017. It enhances the original eNPS by adding an additional question. Employee Net Promoter Scores used to simply be the answers to the question: “How likely are you to recommend our company as a place to work?” The additional question is “To what extent do you agree with the following statement: I am inspired by my job.” It is measured on a five-point scale.
Bain research showed that verbatim comments relating to recommendation were mainly about basic needs and things about which employees are dissatisfied. The inspiration question produces verbatim responses that are about their higher-level need and suggestions for a positive future. The two rating questions are followed by the standard “Why?” and “What could we do better?” questions. Note that I continue to use ‘eNPS’ to refer to the new format. And it is also the case that the Bain website still (as of September 2019) contains references to the old eNPS format.
How not to measure employee satisfaction
Most companies that measure employee satisfaction do so once a year. Data collection is a significant exercise and a typical survey has about 80 questions. Analysis is often done by a third party. Results are usually available four to eight weeks after the survey period ends. Companies may further delay publication for various real or imagined reasons, such as not wanting them to compete for attention with quarterly earnings messages. Sub-scores are calculated for areas like employee engagement, or compensation & benefits. There may or may not be open questions with free text input.
To use an old saying, the result of such surveys is far too much data and far too little information. Let’s suppose your employee engagement questions score lower than last year, and lower than the average for your industry. Since you only have numbers, you don’t know why it happened. The usual first phase is one of denial, “Well, we had a major management change right in the middle of the survey period, so the change is understandable. Let’s wait until next year to see if we need to act.” If you can get through that sort of reaction, the next phase is one of focus groups. You may have collected data from 10,000 people, but the decisions about what to do are given to a group of ten people, for example. You could just have started there, skipping the survey, if you think that is a good approach.
Benchmarks
There are no recognized benchmark suppliers for eNPS. The Mayflower group in the USA and the RACER group in Germany have set up agreements among member companies to share employee survey data. The IT Survey Group (ITSG) is a recognized source of non-eNPS employee survey benchmark data for the IT industry. Member companies agree to ask 60 survey questions in exactly the same format, and using the same rating scale. They then use the average ratings as a norm for their own scores. There are no verbatim questions in the ITSG data set, so there is no information on what the average IT industry employee would like his or her company to improve.
The 24 companies shown below are the ITSG members as of September 2019. They all use the long-format surveys ITSG membership requires. At HP, we took the comparison with ITSG numbers seriously. We just did not directly know what to do.
Let’s make it a lot simpler
The new four-question eNPS format used for Net Promoter for People presents an obvious way of doing simpler surveys. You already have all the demographic information you need about them, so analysis should be easy. Yes, the demographics matter a lot. Men and women tend to give radically different answers, for example. Happiness also tends to decrease with increasing length of service.
No matter what the demographic group, the trend is more important than the absolute number. This brings us to another advantage of the eNPS method. I recommend sampling one-sixth of your population every month, sending new survey requests each and every day. The great advantage this brings is that you will be able to see the effect of different things happening in your company, such as earnings announcements, new product announcements, executive arrivals or departures, and even external factors such as a stock market crash or an election.
Follow the NPS framework
The NPS framework works for eNPS as well. Employee feedback is usually anonymous. Typically, a manager will only receive a report if at least eight of her employees have provided feedback. The Inner Loop then takes place at the level of each team. The Outer Loop addresses company-wide improvements. Regular Huddles are the correct way to drive progress and ensure interlock between inner and outer loops.
Indirect advantage
On top of simplicity and the ability to do continuous monitoring, there is an indirect benefit. All employees will become familiar with NPS. They will easily understand that you are asking customers and employees similar questions and follow the same improvement process. Of course, if you take no visible action on the employee feedback, it will be harder to persuade employees that you are indeed acting on customer feedback. You need to do both.
Cultural differences matter a lot in traditional employee surveys and less in eNPS
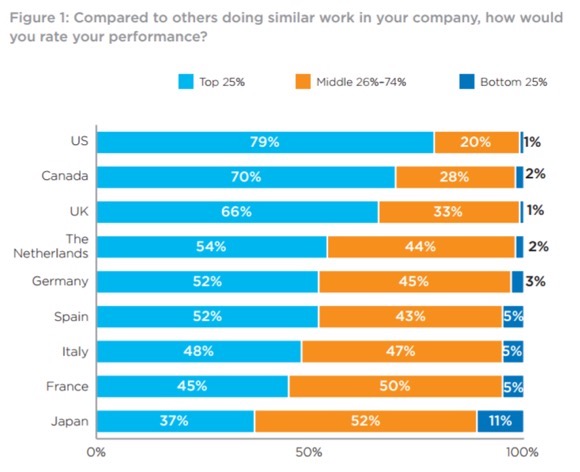
While cultural differences matter somewhat in customer surveys, they seem to matter a lot more in employee surveys. CEB (www.cebglobal.com) has published the graph below that emphasizes the point. In short, unrealistic self-perceptions of performance are common. These differences are greater than those found between countries for customer surveys.
Personally, I find the table surprising. North Americans use ‘curve grading’ in their schools. Curve grading means that a fixed proportion of a class gets an ‘A’ grade, a ‘B’ and so on, no matter what the objective level of the class is. Most Americans therefore grow up having a realistic view of how they compare to others in the classroom. Apparently, this knowledge is discarded when they enter the world of work. Curve grading is rare in the other countries on the list. Could these facts be related? I could speculate, but don’t really see how they could be.
In short, unrealistic self-perceptions of performance are common. These differences are greater than those found between countries for customer surveys.
An additional communication challenge
We have seen that you should not compare countries to each other in your reporting. A fair way of reporting on countries would be to show only the trends, not the absolute numbers. Just leave the numbers off the y-axis in your graphs. There is an additional communication challenge with eNPS. I have generally seen eNPS scores that are about 20 points lower than the customer scores for a given business. What that means is that eNPS scores are far more likely to be negative numbers than are customer scores.
As previously advised, if your first report on a topic only contains bright red negative numbers, your audience will intuitively deny the reality of your report and ignore it. Rather than perverting the system by (say) adding 20 points to all the numbers to ‘normalize’ them, I suggest devoting the first report entirely to the improvement suggestions and the answers to the Why question. You can supply the positive or negative eNPS trend numbers from the second report on, without necessarily providing the absolute scores at all. You may like to believe your audience will have a rational response to a set of negative numbers, but they will not. Intuition rules. Deal with it.
Conclusion
Use eNPS as your primary ongoing survey methodology and execute it continuously. If you (mistakenly, I believe) think you get value from participating in a benchmark consortium, continue to do that huge survey for a year or two, comparing the actions you take from each survey type. I am confident you will discard the consortium survey, particularly as it does not give you direct insight on the performance of any individual competitor. If you genuinely want to improve things for your employees, just ask them what to do, then do it. The Employee Net Promoter System and Score are the most efficient and effective way of doing so.
Next time
The next article will be about a new concept: asking your employees to tell you what improvements customers would like to see.
As is often the case, the above is a slightly-edited version of a chapter in one of our books; in this case Net Promoter – Implement the System All of our books are available in paperback and Kindle formats from Amazon stores worldwide, and from your better book retailers.