#90 – The relationship (or not) between employee and customer satisfaction
 A different sort of newsletter this week. I have combined two blog posts on my annual study on the relationship between employee and customer satisfaction to make this special edition. Just like the last two years, I found that the relationship between the two factors is far weaker than most of us would like to believe. This year’s study is a bit larger and now covers 398 businesses that sell to US consumers. I hope you enjoy it. Please forward it to your colleagues and friends as you see fit.
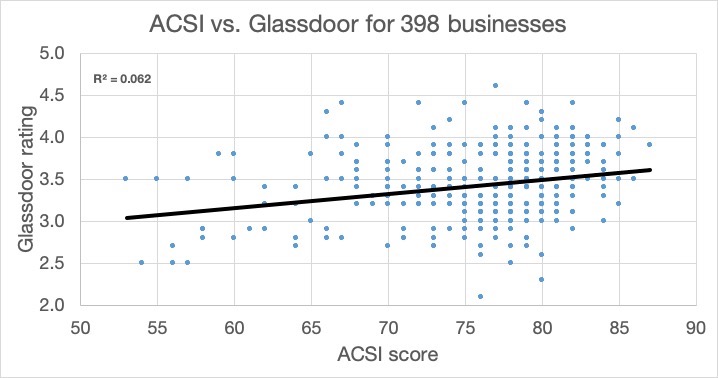
“Everybody knows that happy employees make happy customers.” “Satisfied employees are the single most important driver of customer satisfaction.” In reality, I don’t believe employee satisfaction even makes the top three for most businesses. And I think I can prove it. This is the third year in a row that I have studied the relationship between customer and employee satisfaction for large companies that sell to US consumers. The results have been consistent: There is almost no relationship between employee and customer satisfaction across the 398 business covered this year. Employee satisfaction explains just 6% of the variation in customer satisfaction across these companies. Mind you, “Almost no relationship” is better than my findings in 2017, which were simply that there was, on average, no relationship. Within the overall results there are exceptions and surprises. There are industries and entire sectors where employee satisfaction matters a lot more. There are also striking examples of companies whose employees hate them while their customers love them. The opposite is also true. And these are big names. Let’s beginBack in 2017 I asked myself whether there was any actual evidence for the many statements that I could find that were similar to those at the top of this article. What I found was highly disappointing, to say the least. I found low-volume studies. I found attractive anecdotal studies based on single companies. I found low-volume and single-company studies about employee engagement, which is a different subject. More on employee engagement later. In short, the whole subject had not been studied scientifically. Repeating my searches before writing this article gave the same result. Nothing useful. It is not surprising that the subject is tricky to study. Companies do not disclose the results of their own internal employee surveys. High-volume public benchmark data about customer satisfaction is also rare. However, it does exist, as does a single high-volume source of employee satisfaction data. I use Glassdoor data for employee satisfaction and the American Customer Satisfaction Index data for customer satisfaction. This year I was able to match the two for 398 businesses. Here are the highlights: Overall results
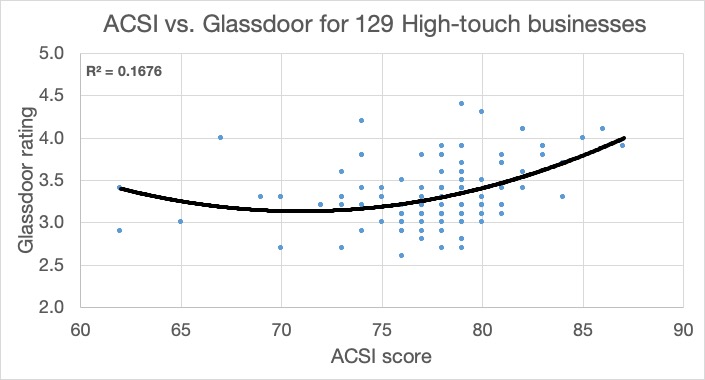
At the top level and across all businesses, variations in employee satisfaction explain 6.2% of the variations in customer satisfaction. However, I somewhat arbitrarily decided that 129 of these businesses, such as hotels, retail stores and airlines, are ‘high-touch’. By this I mean that employees have regular face-to-face contact with customers, where their smiles and empathy may make a difference. The remaining 269 are ‘low-touch’. I have used quadratic regression for the graphs below and think they are interesting. High-touch businesses
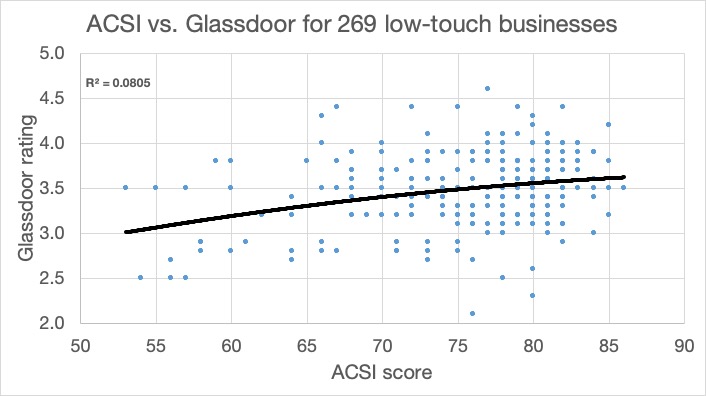
For the high-touch businesses, variations in employee satisfaction explain 16.8% of the variations in customer satisfaction. Among well-represented industries, the nine hotel chains top the list at 61.8%, followed by 17 supermarket chains at 49.1%. Low-touch businesses
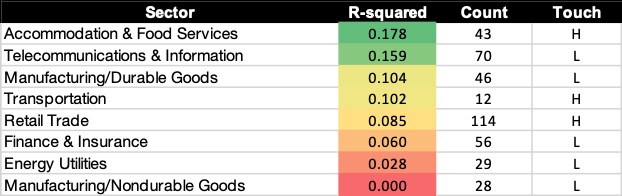
At the other end of the scale, low-touch industries have an average of 8% interdependency between employee and customer satisfaction. The energy utilities industry is represented by 23 companies and shows no relationship at all. I don’t find this surprising. When was the last time you spoke face-to-face with an energy company employee? In my own case, they don’t even need to come out to read our meters anymore. Performance by industry sectorACSI data is provided by company and by industry, and the industries are grouped into sectors. Some sectors do better than others as you can see in this table:
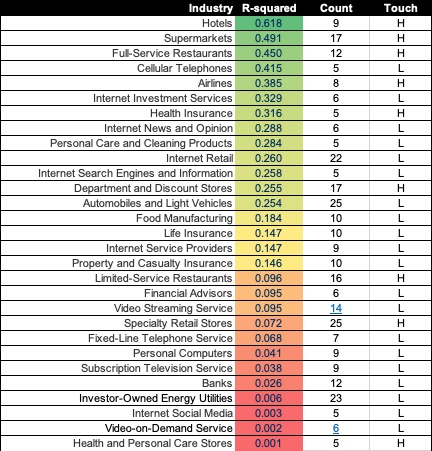
Retail does rather worse than last year. While it might be tempting to say that this is because Internet Retail is now included in Retail, that’s not the problem. Health and Personal Care stores now have no relationship between employee and customer satisfaction. Performance by IndustryI removed all industries represented by less than five businesses from the table below. This may not be entirely fair. After all, if there are only three large businesses in a particular industry in the USA, the ‘Normal distribution’ rules of statistics don’t apply. If there are only three and you cover them all, you have a good sample. Similarly, there simply aren’t 30 major hotel businesses in the USA, so any preconception you may have that you need a minimum of 30 for a valid sample is simply wrong. In any case, you will be able to make your own judgments when you download the data.
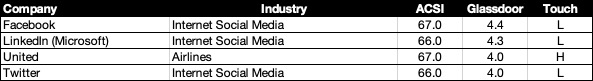
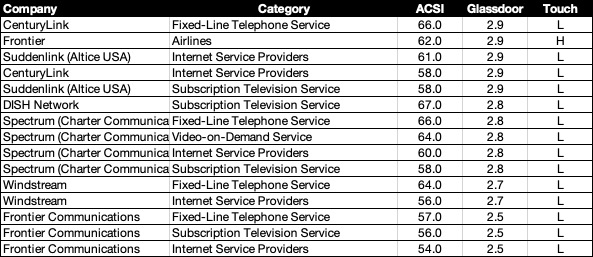
It should not surprise you to see hotels, supermarkets and restaurants at the top of this list. For hotels, employee satisfaction variation explains 61.8% of the variation in customer satisfaction. Employees are an integral part of the experience in these industries. For many of the industries close to the bottom, we never come into face-to-face contact with the employees, so the lack of a relationship between employee and customer satisfaction should not be a surprise either. And here is today’s Fake News (though the quotes are real):“Our core values: … Put the customer first…” – Frontier Communications website “We take pride in knowing how to take care of you.” – Message to potential employees on the State Farm website “Our team members are the key to our success. Whether they work behind the scenes or are out there delivering great service to our guests.” – Frontier Airlines website This is the second article about the results of my third annual study of the relationship between employee and customer satisfaction. The first article is here. This time I will cover love and hate, stars and goats. (What a program!) Love-hate relationshipsHere are the companies whose employees love them while their customers hate them. From a data perspective, this means they are in the top 10% of the Glassdoor scores while being in the bottom 10% of the 398 ACSI scores. There are just four companies in this category:
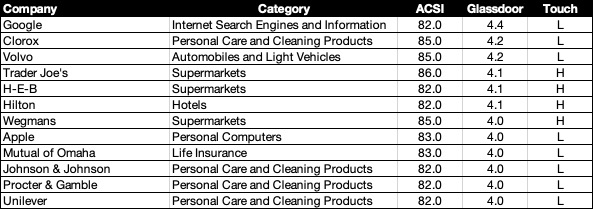
Should we be surprised by the positions of the three social media businesses here? Great employment conditions and the fact that the customers seem to hate them is not really a major source of concern. We could debate whether the US consumers answering the ACSI feedback requests are actually the customers. After all, the companies’ main source of income is from advertisers, who were not asked. As for United Airlines, I think the few high-profile nasty incidents they had with passengers last year and in 2017 made a difference to perceptions. They had the biggest drop of any airline. My prediction is that it will all be forgotten in 2019 and they will have the biggest improvement. And there is just a single company in the opposite category. Kraft Heinz employees give them an appalling Glassdoor score of 2.9, while customers give them an ACSI score of 82. I think it is safe to say that Kraft Heinz employees have a lot to deal with these days and never come into contact with end consumers. Companies that seem to get everything right – The heroesYes, they exist. Here are the companies that are in the top 10% on both the ASCI and Glassdoor lists:
Note that the list is in the order of the Glassdoor rankings. Hilton topped the ACSI list for hotels for the fourth year in a row, and their employees love them too. Do you see anything surprising here? I don’t. Companies that seem to get everything wrong – The goatsPersonally, I think goats are cute and I am not sure why various BCG-style business models cast them as the villains. Anyway, here are the companies that managed the difficult task of being in the bottom ten percent for both their customers and their employees:
Should we be surprised to see the lower table almost exclusively populated by ISPs and TV service providers? I think not. Telecommunications companies have a reputation for disdain of both customers and employees. Are these comparisons fair?No, the comparisons are not fair, at least as far as customer satisfaction is concerned. Customer satisfaction varies strongly by industry. There are industries, such as telcos, cable TV companies, and Internet Service Providers, that have little or no opportunities to ‘delight’ us. If they do their jobs perfectly, we simply don’t notice them. We only notice them when things go wrong. So it is to be expected that they would do relatively poorly in customer satisfaction comparisons that cross industry lines. However, that is no reason for them to treat their employees badly. ConclusionWe should not find the lack of a strong relationship between employee and customer happiness very surprising, for two main reasons. First, a company’s products and services are generally far more important to customers than the employees. The main exception to this rule is where the employees are the product. Second, employee happiness and employee engagement are two quite different concepts. Employees can be happy with their pay, the food in the company restaurant, and their commute to work. None of these do anything for customers. Employee engagement is a more sophisticated concept that lacks a standard definition. When I worked at HP the Employee Engagement Index was an aggregate of nine questions. Other companies use different standards, as does every study I have read on the subject. (For the experimental scientists among you, this smells of ‘p-hacking’. Ask a lot of questions in your employee survey. Determine after the fact which set of ten have the best correlation with revenue growth. Combine them in some way and call that your ’employee engagement index’. That’s cheating!) DataI have put an Excel sheet with the data here. There are four tabs. It is not very pretty. I have inspected it in various ways but may still have made some sort of error. If you find one, please let me know. Lots more writing like this in our books. All of our books are available in paperback and Kindle formats from Amazon stores worldwide.
You can also email me, Maurice FitzGerald, at mfg@customerstrategy.net. To change your subscription, click here.
|