NPS (4) – Competitive benchmarks and supplier surveys
Quite a few companies sell NPS benchmark data. Some will do custom surveys to your design. Done properly, benchmark survey trends are the best predictor of revenue and market share trends for your company. Since benchmark surveys provide comparative data, they are actually the only credible predictors. All other survey types cover only your company. Feedback about your product may be improving, but if that for your main competitor’s product improves more, you will lose share. Unfortunately, most vendors only provide annual benchmark information as a standard offering, though Bain’s new Prism offering is an exception. If you are in an industry that does not change quickly, annual updates may be reasonable. For most businesses, and to keep customer experience as visible as financial results, you need benchmark data quarterly, at the very least.
The ‘Why’ matters more than the trends
The score trends for your company and competitors are useless without knowing why. If you buy benchmark reports that do not include reasons why, they are not worthwhile and you should change vendors. The reasons behind positive and negative relative trends need to be explained at the same time as the numbers. The best benchmark vendors also provide improvement suggestions that are customized for your company and your competitors.
Use rolling quarterly reports for benchmark surveys
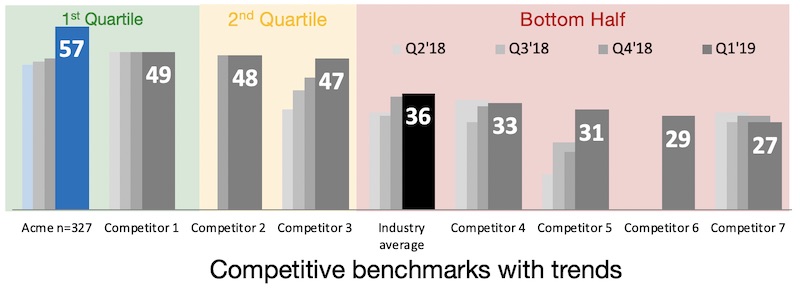
It can be expensive to get statistically significant NPS volumes for all of your competitors every quarter. Using a rolling four-quarter average is fine. This means your Q1 report will also include the data from the prior Q2, Q3 and Q4. Drop the oldest quarter as soon as you have a new quarter of data. Your reports should show multiple rolling quarters so trends are easy to understand. The graph at the top of this article shows a good way of communicating quarterly rolling trends.
The good and bad of double-blind benchmark surveys
The best benchmark surveys are double-blind. This means the people answering the survey do not know who is funding it. Unfortunately, it also means that you have no way of knowing the names of those who have answered. The positive aspect of this is that neither you nor your competitors can try to influence them. On the negative side, you can’t follow up with anyone you would like to use as a reference or who has serious concerns.
When you receive benchmark data, it is ‘unweighted’. For some businesses, equality of respondents is a good thing. For most businesses equality of all respondents in a bad thing. While you should get data about the sizes of the companies and the job titles of people represented in a business-to-business (B2B) survey panel, I have never seen it used in practice. Customers with large budgets and small budgets are mixed together. Responses from people who are decision-influencers have the same weight as those from decision-makers and indeed from end users. Once you slice and dice the data, you quickly get into issues with the ‘law of small numbers’. By this I mean that you will see outliers that are just due to statistical variability in small samples. The subject is tricky, and I will cover it in another article.
I am not aware of any satisfaction benchmark that compares benchmark survey providers. The quality of the benchmark results depends on the relevance of the people who answer the questions. This is probably where you should spend most of your investigation time when selecting a new vendor. Ask to see the profiles of the panel members that will be used for your work. Ask for samples of the text input the vendor has received. They may only be willing to provide it for a different panel, used for a different industry from your own. The vendor should have no difficulty removing company names to make data anonymous.
Panel members usually receive points or other cash-equivalents that they can redeem for merchandise. I don’t believe anyone could make a living from being on many panels and taking surveys full-time, though you may have seen get-rich-quick schemes advertised on the internet that suggest it could be done.
Supplier surveys
In business-to-business situations, some customers regularly survey internal users of products and services and provide the resulting feedback to their suppliers. This is a form of benchmark survey in that each supplier is given a report that compares them to other suppliers. In some cases, you will see the names of the comparison companies and other cases they are just shown as ‘Company A’, ‘Company B’ and so on. Supplier surveys are my favorite type of B2B research, for a simple reason. Your customer is highly motivated to see you improve.
The first such process I was involved in was Vodafone’s Supplier Performance Management initiative. The person who set it up for Vodafone was subsequently headhunted by BP in Houston to do the same. The survey was run by the procurement department. They were measured on supplier performance improvement from year to year. They wanted us to present our improvement initiatives to them, and were very helpful in providing contacts at their end, and helping us with the work. Companies that operate their own supplier surveys usually decline to participate in other relationship surveys you may be running.
Correlation and regression analysis can be useful in benchmark studies
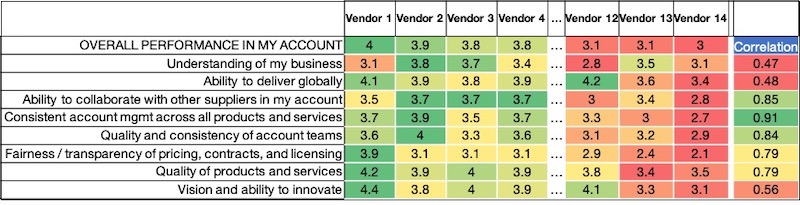
If you have limited written commentary and multiple questions have been asked in the benchmark survey, simple correlation analysis can be helpful. Here is a good example from the ICT industry. The Research Board is a Gartner-owned entity. Its members are about 260 CIOs and former CIOs from the Fortune Global 500. One of their annual projects is a supplier survey. Members rate each of their major IT and communications providers on many factors. An anonymized version of one of the results tables is shown in the table below. I used Excel to do simple correlation analysis between the overall scores and individual factors. I then used Excel’s conditional formatting to make it more readable. The correlation scores on the right suggest the weight of each question in the overall performance score.
Correlation, of course, is not the same as causality, and the written comments help. The main body of the table contains the scores, where 5.0 is the maximum possible. Account management comes out as the most important factor. Surprisingly and counter-intuitively, ‘understanding of my business’ is the least important item. Note in passing that vendor 14 has finished last in the survey for many years and is one of the most profitable companies on the planet. You don’t have to be loved to make lots of money. Having an effective monopoly in your area is another way of doing it. The Research Board survey does not include the recommendation question and each company covered only receives customer comments and improvement suggestions for their own company. Since there is no charge to the vendors for the report, it is fabulous value.
Syndicated benchmark surveys may be the future
When I have shared benchmark survey results with my equivalents at other high-tech companies, I have been pleased to see that the NPS numbers and trends look similar in their surveys. This simply suggests that there are good NPS benchmark vendors covering high-tech. All customer experience leaders I have met have been highly irritated by competitors that publish non-benchmark scores, representing them as fair comparisons. This makes me feel that a good solution for many industries would be for the leading vendors to get together and agree to use a single benchmark provider as their reference. I believe it would be easy to get competitors to agree on the core NPS questions. Each would be free to pay the survey provider for additional questions if they so wished. Additional companies would be free to pay a fee to join the consortium. I suppose a challenge is that non-customer-experience executives from companies that do poorly would want to cut off the vendor, rather than address their issues. A first such offering exists. Bain and Qualtrics announced a joint syndicated benchmarking offering in March 2019. They call it Prism, and initial demand has been strong. Their announcement press release describes the service as ‘continuously updated’’.

Looking forward
The next article in this series will cover will be about how to understand your relationship and improvement opportunities with large B2B customers.
As is often the case, the above is a slightly-edited version of a chapter in one of our books; in this case Net Promoter – Implement the System All of our books are available in paperback and Kindle formats from Amazon stores worldwide, and from your better book retailers.