
NPS (17) – Does culture affect NPS / customer survey outcomes? – 17th in the series on NPS
This is the 17th article in a series on the Net Promoter Score and Net Promoter System. This time I cover cultural differences in the way people respond to surveys.
As a person who has lived and worked in seven countries, I believe cultural differences exist and matter. My career has taken me regularly to countries in Africa, Asia, Europe and North America and I have directly observed that people behave differently, especially in business situations. A lot has been written on the subject. My favorite book on the subject is When Cultures Collide by Richard D. Lewis [1]. Cultures and Organizations by Hofstede and Hofstede[2] is also excellent. I got into the habit of studying the When Cultures Collide chapter on a new country before visiting for the first time. I suppose my most educational experience was in Jordan.
Comfort zones in different countries
Along with all the science, Lewis tells entertaining stories about the effect of comfort zones on behavior in groups. In Northern European and North American culture, the ‘comfort zone’ extends to arm’s length. What this means is that people from these cultures become uncomfortable when someone is less than a full arm’s length away from them. They will tend to back away from someone the feel has come too close. In Southern Europe, the comfort zone is half that, meaning elbow’s length.
Lewis describes multinational meetings, for example European Union social gatherings, where the Southern Europeans back all the Northern Europeans into the corners of the room by the end of the evening. His chapter covering Jordan mentions that the local comfort zone is half again what you find in Italy. He also mentions what happens when you are being successful in your discussions. He was not wrong.
Opening HP’s office in Jordan
I went to meet the Minister for Information and Communication Technology together with an American colleague. We wanted to negotiate a series of things to do with opening an office and potentially a software center in Amman. My American colleague had not read the Lewis book, and I did not say anything about what I was going to do in advance. I sat just left of the minister. When the time came to have the critical discussion, I moved to about 20 cm/8 inches from his face, and …this is critical… did not lose eye contact at any time while we spoke. I could see my American colleague getting twitchy while this was going on. And yes, the sign of success then happened. The minister put his arm around my shoulders. We had never met before. My colleague’s eyes were popping out. Success! I had learned how to do the male cheek kissing version that is specific to Jordan, but did not get to try it out as we did not socialize beyond the meeting. On a side note, the best coffee I have ever had in my life was in that office. Something to do with flavoring it with cardamom seeds, I think.
Culture matters, but does it affect customer surveys?
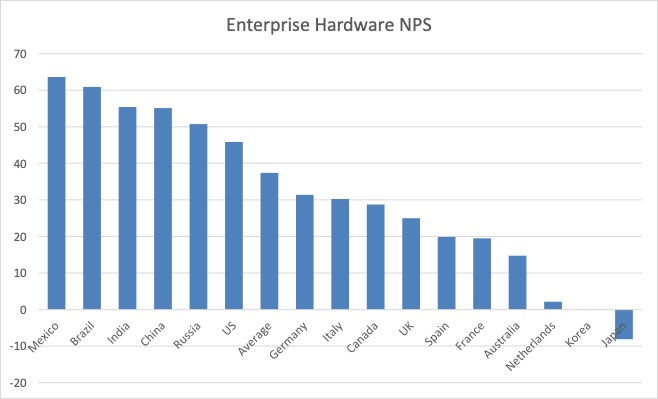
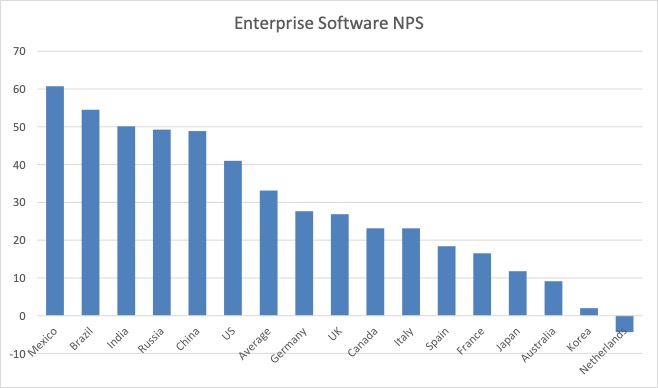
After many years using double-blind surveys at HP and seeing responses that were consistently different by country, I became certain that the sole explanation for the differences was culture. Exhibits 3.4 and 3.5 show what the NPS scores looked like by country for the combination HP and its major enterprise hardware and software competitors respectively, by country. This excludes consumer PCs and printers. The data is for a three-year period and the sample sizes are absolutely massive.
So therefore
The only possible conclusion from this data is that the Japanese, Koreans, Australians and Dutch are grumpy people and don’t want to give top grades to anyone. Right? The only possible conclusion? That is certainly what I thought before going to meet Rob Markey for the first time in August 2015. Before getting into what he told me, think about it this way. The data above represents customer views on the major IT suppliers around the world. Almost all are US companies. Almost all try to do business in other countries exactly the way they do it at home in the USA. Almost all believe that this is the best and only way of doing business and that any other way of doing business is inferior, or perhaps just costs more.
The perception is widespread
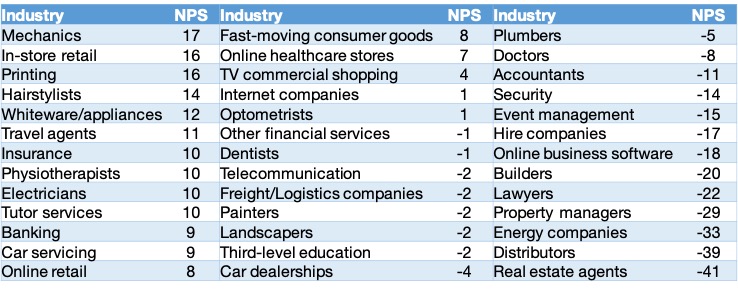
Do a web search on cultural differences in Net Promoter Scores, and you will find a consensus that the cultural differences in scoring are real and look something like the graph above. Even Bain consultants used to agree. Back in 2006, Jayne Hrdlicka, Edmund Lin, Gary Turner, Bruno Lannes, YeonHee Kim and Shintaro Hori published How to win—and retain—loyal customers in Asia and Australia . It includes many examples of NPS score ranges from different industries. Most of them have negative average scores. There are also some ‘normal’ scores in the mix, which should not be possible if the cultural paradigms are 100% correct. By this I mean that either ‘all Australians are grumpy when responding to surveys’ or they are not. Both cannot simultaneously be true.
There is data that supports the existence of cultural differences
Per.ceptive (Customer Monitor) is an Auckland-based company that publishes consumer NPS benchmarks for Australia and New Zealand, among other work. Their work on consumer benchmarks seems to support the ‘grumpy Australian’ viewpoint. The only other possible explanation would seem to be that all types of Australian companies don’t care much about their customers. The report in Exhibit 3.6 is from August 2016.
There is limited though reliable data that says the opposite
If the bar graphs really reflected cultural differences, then there would be no benchmark NPS scores in these countries that would show anything different in any industry. Not only is there in fact benchmark data from the ‘bottom four countries’ that has similar scores to those observed in the United States, but some of the data is for high-tech. ING Direct Australia scores a 38 in double-blind sampling. Local IT outsourcing suppliers working in Dutch score in the 30s in the Netherlands, though Dutch Telco KPN has an 11.
OK, so these are cultural anecdotes
Here are a few short examples that gradually changed my views about what was going on:
- You should adjust to local conditions if you are not from the country. I remember being beside Francesco Serafini, then the HP Managing Director for Europe, Middle East and Africa, when the CEO of Philips Electronics phoned him. They had recently transferred their IT help desk operations to us. Nobody had told the CEO that one way cost had been reduced was by eliminating Dutch as a language for telephone support. He was angry, to say the least. Angry with us and angry with his CFO who had signed the contract and had not told him about the change.
- According to a former Apple employee I met socially, the Tokyo and Beijing Apple stores had the lowest NPS scores among all stores worldwide, at one point in time. They did deep research into local habits after asking themselves whether the way they did business in New York and San Francisco was appropriate in China and Japan. The first thing to change was the introduction of ‘fast checkout’ for a set of commonly purchased items that were put against one wall. The customers could avoid the friendly-but-lengthy typical Apple experience and get out of the store quickly. NPS scores rose to and even above the company average quite quickly.
- I met Bill Thomas of EquaTerra at an IT event. EquaTerra had just published the customer satisfaction benchmark numbers for the Benelux for the IT Outsourcing industry. All multinationals (HP, IBM, Accenture) did badly, and many local providers did very well. I asked him to tell me the top reason why. He said it was because all the local providers had their support teams physically in the Benelux and they all spoke to customers in their languages and accents. The multinationals all operated offshore, providing support in English for the Netherlands and Luxembourg, and non-Belgian-accented French for the Belgian customers. He said this was a pattern in other countries too. The multinationals may have had lower costs, but the costs were quickly forgotten after the contracts were signed.
- A local radio station reported on an esoteric study on how people wanted to be addressed by doctors in hospitals. In the United States and the UK, the vast majority of patients wanted doctors to use their first names. In France none did, preferring their family names. I suspect the answers would be even more extreme here in the French-speaking part of Switzerland where you are expected to know someone before going further than “Sir” or “Madam.” Indeed, in a recent newspaper article a number of Swiss rail passengers were complaining that the staff inspecting their annual rail passes thanked them and used their family names, which they considered totally unacceptable.
- During a discussion about NPS scores in Australia, a person I met at a Satmetrix conference asked me from where we provided telephone support for Australian customers. I told him it was done from India for the business in question. He told me that many Australian IT companies had tried that, but had moved support back onshore to have people on the phone with Australian accents, despite the cost. HP’s consumer support people did something similar when moving UK telephone support back to the UK from South Africa.
More Bain experience
I went to my meeting with Rob Markey armed with my data and convictions. He persuaded me that I was wrong, at least partly. He described his experience working with an unnamed American company’s operations in Japan. The Japanese operation had had the worst NPS scores in the company for years. To get a new answer, they asked themselves a new question, “What if the problem is not the supposedly grumpy Japanese? What if the problem is us, and the way we do business in Japan?” That was a transformative question. Bain and their client did deep research on the way Japanese customers wanted to be served. They adjusted the way they did business from top to bottom, and it does not look like any other country. Japan now consistently scores in the top three countries on the corporate NPS chart. Going back to the anecdotes, the company in question had had a policy of always addressing customers by their first names, even in Japan. Totally unacceptable. That was one of the first things they changed.
Suggestions
What all this means is that cultural differences exist in responses to NPS surveys, and the reasons may not be entirely what you think. At a pure survey level, yes there are cultures that are reluctant to give you the top score. This is a good reason to use the zero to 10 scale for NPS ratings rather than 1 to 5. People who have a cultural reluctance to give you a ten may still give you a nine. There are cultures where customer-centricity has not evolved to the extent it has in the United States. An American company offering US-style service there may do very well compared to local expectations. This may be what we see happening in Mexico and Brazil in the IT industry, for example. There are other countries where behaving in the excessively friendly American way may be totally inappropriate. If I were to suggest remembering one thing when you see low scores in a country, ask yourself, “What if the problem is not the customers? What if the problem is us?” Answer that question before your competitors and you will win.
Communicating multi-country competitive customer experience scores
If you have competitive benchmark scores and graphs like the ones shown above, you should never present them in the way I have. For most companies, competition is local. It does not actually matter much that you and your competitors average an 8 in Australia and a 50 in India. I suggest showing individual country competitive comparisons without showing the rating scale at all. Show the tick marks on the graph but no numbers, or just relative numbers compared to your score. What you want in Australia is for your NPS trend to be better than that of your competitors, no matter what the numbers. Comparing country scores to each other mainly wastes time and delays getting on with improvements. Only removing the numbers from the scoring scales can help avoid your audience making irrelevant comparisons.
[1] Richard D Lewis: When Cultures Collide, 2005, Nicholas Brealey Publishing, ISBN 978-1904838029
[2] Geert Hofstede, Gert Jan Hofstede and Michael Minkov: Cultures and Organizations, 2010, McGraw Hill Education, ISBN 978-0071664189
Learning check
Decide whether each of these statements is true or false. Answers below.
1. Even the font you use in an email asking customers to take a survey can make a big difference.
2. To make sure you are doing a good job, you should always send a survey request to every customer who phones your service center.
3. Embedding at least the rating question in a survey request email improves response rates by about 2.5 times.
4. Culture makes no difference to survey responses, so it is always fair to compare countries’ NPS performance with each other.
5. Low survey response rates tend to give overly optimistic NPS scores.
6. The more questions there are in your survey, the more likely people are to complete the survey, as it is clearer that you value their opinions.
[Answers below.]
Looking forward
The next article in the series will be about the all-important question of whether or not NPS trends predict revenue and market share trends. Deep stuff.
As is often the case, the above is a slightly-edited version of a chapter in one of our books; in this case Net Promoter – Implement the System All of our books are available in paperback and Kindle formats from Amazon stores worldwide, and from your better book retailers.
 Answers to the learning check questions
- True. Using a serif font like Times New Roman in emails improves response rates compared to using a non-serif font like Arial.
- False. You should only survey if you have the people, funding and plans to act on the input.
- True, at least in the author’s experiments. There are software vendors who say that it triples response rates.
- False. Do your best to make all competitive comparisons local. Comparing NPS scores between countries is not helpful.
- True, and the effect is substantial. You can only consider an NPS survey to be truly representative of the customer population when you have response rates above about 50%. Such numbers are rare for transactional surveys, another reason to be selective when using them.
- False. The longer your survey questionnaire, the more people will drop out before completing it. Compared to a 3-question survey, about 6% of the people who start a 20-question survey will not complete it, rising to 10% for a 40-question survey.


August 1, 2019 @ 10:53 am
Hi Maurice,
Great article. I remember when we in HP regionalised the Call Centres and made the assumption that local language (i.e. non-native country members, speaking the countries language for instance French being spoken by an Italian) would not impact the customer experience and the resultant NPS. It was a disaster, as the people, whilst being able to speak to the customers, did not understand the local nuances .
August 4, 2019 @ 2:28 pm
Hi Martin,
Yes, I remember we even moved UK consumer support back from South Africa to somewhere in northern England to deal with pushback we received about the accents of people taking calls.