Is the Net Promoter Score (NPS) dead?
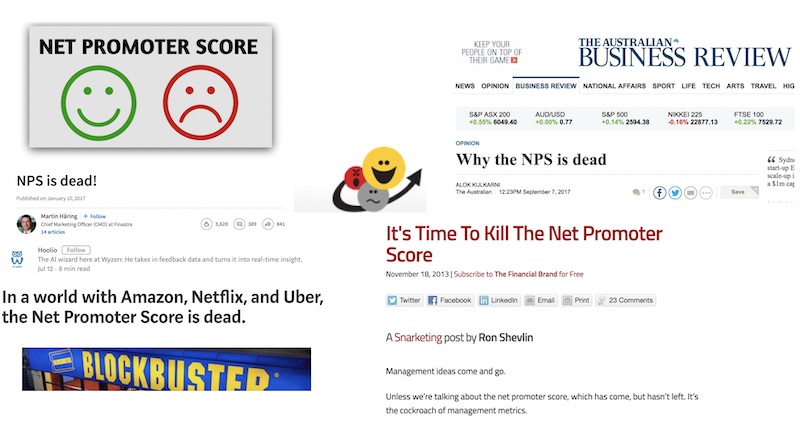
The Net Promoter Score is dead! Or are the reports on NPS simply fake news? Well, the image at the top of the article shows what I found with a simple Google search. So… is the Net Promoter Score dead? Here are the views of two important people:
 And of course this well-known quote:
 For reasons I won’t go into at the moment I have had to research what those who do not support NPS have been writing over the years. Here are some of the objections I know about and what I think of each. If you have others in mind, let me know and I will provide my perspective.
‘Compound metrics’ are better predictors of revenue and market share trends than NPS’
Yes, this is true in many cases. It is possible to design and implement more sophisticated measurements that are better predictors and a number of them exist. Reichheld and Markey have never claimed otherwise. Reichheld’s original contention was simply that the recommendation question was the best single-question predictor among those studied, for the majority of industries. The issue with compound metrics and the reason none have ever caught on is that they are extraordinarily difficult to explain. And because they are not common, every single communication about the results has to start with an explanation of how the metric works. Too boring. Audiences go to sleep, no matter what the value of the sophisticated metric is.
The recommendation question is not always the best or most predictive single question to ask
Yes, that is true and Reichheld says so in his 2003 HBR paper. Indeed, he refers extensively to Enterprise Rent-A-Car in his paper and the question they ultimately used and that turned out to be a great predictor for them was ‘Please rate your overall satisfaction with your rental’. When eBay implemented NPS their target customers were people making their living selling things on eBay. The found that when they asked the recommendation question they got answers like “No, I am never going to recommend to a friend that they should compete with me on eBay.” So they implemented “How likely are you to continue selling on eBay?’ and continue to use that question to this day.
Lots of other things affect growth more than NPS
That is certainly true in some industries. Overall, Bain and my own research suggest that NPS scores predict between 20% and 60% of revenue / market share trends, depending on the company. There are clearly industries where external factors drive 100% of the revenue and customer satisfaction will drive market share only. Take gold sales. Revenue depends on the price of gold. Market share will partly depend on how customers feel about you compared to your competitors. Where there are monopoly providers of essential resources like electricity, customer sat has no effect on revenue, as should be obvious. You can the relevant information from Reichheld and Markey here.
NPS is easy to game
Yes, that is true, and the same is true of every other metric like CSAT or Customer Effort Score. Here is a blog I wrote about how to cheat a couple of years ago. https://customerstrategy.net/gaming-survey-results/
Companies publish fantasy numbers as their NPS numbers in their annual reports
I wish that were not true, but it is. The only number they should publish is a double-blind competitive NPS benchmark score. Some companies choose to publish numbers that correspond to some positively-perceived subset of their business such as a support desk that only a minor proportion of their customers actually use. Again, the same self-measurement phenomenon could happen with CSAT or other metrics.
NPS is not a good predictor of revenue
While I will go into specific papers about the topic below, I want to make a few general points first. Not all NPS numbers are equal. The only scores that are consistent and reliable predictors of revenue and market share trends are double-blind competitive NPS benchmark trends. Double-blind means that the people answering the feedback requests do not know who is funding it. Ideally the people analyzing the feedback don’t know either, though this second ‘blinding’ may be tricky to achieve. If, for example, the only NPS numbers you have are feedback from a support desk survey, you should not expect it to predict revenue or market share at all unless yours is simply a support desk business. And of course if your numbers improve but your main competitor’s numbers trend is even better, you will lose market share. I emphasize share rather than revenue because some industries are in decline. If your score is better than your competitors’ scores you may simply decline more slowly in that industry.
We did deep research on this while I was at HP and I have posted the top-level results of the relationships we found between relative NPS trends and revenue in various places. Since then, Dr. James Borderick of Micro Focus has done even deeper research on the subject across more than 30 global software vendors and once again proven the strong relationship between NPS and market share trends. I don’t know exactly what level of detail he has been allowed to publish as his work does of course include some confidential company data.
An often-cited quote from Fred Reichheld about his own research
There is an often-cited quote from Fred Reichheld stating “A number of perspicacious readers have noted that the statistical evidence provided in my book The Ultimate Question is imperfect. It does not provide proof of a causal connection between NPS and growth. Nor are some of the timeframes ideal.”: This quote comes from one of his own blog posts (here) and has been used by a number of people to ‘prove’ that Fred felt his own research was defective. The quote is horribly out of context. Here is what he says immediately afterwards and which proves he believes his research was entirely legitimate. “When the manuscript was completed in mid-2005, that data, imperfect as it was, represented the best available information: 8 quarters of NPS and annual organic revenue growth rates for competitors in a dozen or so industries. Today, this database has grown enormously. Bain has conducted additional research in scores of industries around the world, gathering NPS data and apples-to-apples revenue-growth statistics for individual competitors. Bain teams consistently find that NPS explains the majority of variation in organic growth rates across an industry over many time periods. More importantly, we have found that individual customer responses to the ultimate question predict those customers’ subsequent behaviors across the multiple drivers of profitable growth: repurchase rates, margins, cross-sell, retention, referrals, etc. Many companies, including GE, Intuit, eBay, American Express, and others have seen similar results.”
Proof of the relationship between NPS trends and revenue / market share trends has never been published in a peer-reviewed journal
Not true at all. For example, here is one that Andrew Stephenson, Jana Fiserova, Geoff Pugh, and Chris Dimos had accepted for the British Academy of Management annual conference proceedings. It actually won best paper at their 2018 event. The data is from the UK-based multinational furniture retailer that has over $1B in annual revenue. It is quite a ‘deep’ read. To me, the essential point is their choice of using feedback gathered six months after purchase. This seems like a great way of getting a pure brand-level NPS number. I would like to invite you to take the time it takes to read it, if you are at all interested in the subject. You will see that the relationship between NPS and revenue is established in a quite compelling way. The paper is here. (This should open with a completed search for the name Stephenson, and you can download the paper directly from the search result.)
Keiningham et al. paper ‘A Longitudinal Examination of Net Promoter and Firm Revenue Growth’ – Journal of Marketing vol 71, July 2007
Let me try to be polite about this. It is a disgraceful failure of the peer review system that this article could have been published in the form it was published. Here is a link. While there are a number of issues, the main thing that should have disqualified it from publication is on page 43. During the second of the three years studied the price of a barrel of oil dropped 30%. This is a great example of an industry where you would not expect any customer experience metric to have predictive value for revenue. The only factor that matters is the price of oil. This is so blindingly obvious that I can only believe that it was included in a deliberate attempt to deceive readers. The other half of the same page proves the opposite, meaning a strong positive relationship between NPS trends and revenue / market share for banking. Without the gas station example, the overall conclusion of the paper does not stand up.
However, that was not enough for the authors. They added to the what I feel is the deception with an extensive comparison between NPS and ACSI as revenue predictors, proudly showing that ACSI was at least as good a predictor and thereby ‘proving’ that the recommendation question is not the best single-question revenue predictor. However, they knew that ACSI is not the response to a single question. It is a weighted average of the answers to three different questions so is a compound metric (see above). Keiningham knows about my objection and rejects it as it has not been published in a peer-reviewed journal. He does not deny the facts I set out.
Morgan and Rego paper ‘The Value of Different Customer Satisfaction and Loyalty Metrics in Predicting Business Performance’ – Marketing Science Sep-Oct 2006
In the abstract and full paper the authors write things like “metrics based on recommendation intentions (net promoters) and behavior (average number of recommendations) have little or no predictive value.” Unfortunately, this is another, perhaps even more disgraceful, failure of the peer-review process. Morgan and Rego did not study the recommendation question at all! The paper should never have been published as written. They used the answers to two other questions and then state that they are equivalent to the recommendation question. Here is what is on page 429 of the article: “We utilize ACSI data concerning consumer responses to the questions “Have you discussed your experiences with [brand or company x] with anyone?” and “Have you formally or informally complained about your experiences with [brand or company x]?” I suppose they felt compelled to write something about NPS, had no data at all, and so invented something deliberately deceptive that supported the conclusion they wanted to make.
There are a number of other papers published in various magazines and journals that pick on particular aspects of NPS or specific industries. I have one that covers just two industries, one of which is PC manufacturing. Reichheld said they had found no relationship between IT manufacturing and the recommendation question in his HBR paper, so the ‘finding’ is hardly surprising. Note that for the HBR paper end users of IT were asked, rather than the corporate purchasing decision-makers, so it is really not a surprise that there was no relationship with revenue trends.
I suppose you can tell I feel strongly about some of these objections while considering others to be valid. If you have more that you would like me to examine, please feel free.
More of this sort of thinking in our books. They are all available in paperback and Kindle formats from Amazon stores worldwide.