How demographics affect customer experience research – You should expect surprises
It is tempting to keep feedback requests very short to improve completion rates and avoid wasting customers’ time. However, I have yet to see research where demographics did not make a difference. Sometimes the differences are surprising.
What we mean by ‘demographics’
Demographic information is that which you use to categorize responses. Of course you should never ask people to provide the categories if you already have the information. For web-based surveys, the categories you don’t already know about are normally provided using pull-down menus. Examples are things like these:
- For product surveys, responses may vary depending on whether the respondent is a purchasing decision-maker, an influencer or an end user. Respondents are asked to self-categorize.
- For employee surveys, whether the person works from home, the office or is always on the road may matter.
- For a survey about a software product, it is useful to know what version of the software the customer is using. People using older versions of software may provide improvement suggestions that have already been implemented in the more recent versions. It is then easy to provide instant feedback and make them happy.
Gender matters
Even in B2B environments, women often provide different input to men. You should be able to do the demographic split well enough using people’s names, if you have a few hundred responses. In HP’s research on consumer printers, women mentioned ease of use and overall quality twice as often as men as a reason for recommending the printer. Men mentioned the price of supplies, low ink consumption and value for money twice as often as women. In short, the survey showed that women care about different things than men. It changed the messaging and marketing we used, as well as the training given to people in retail stores.
An example from a student survey
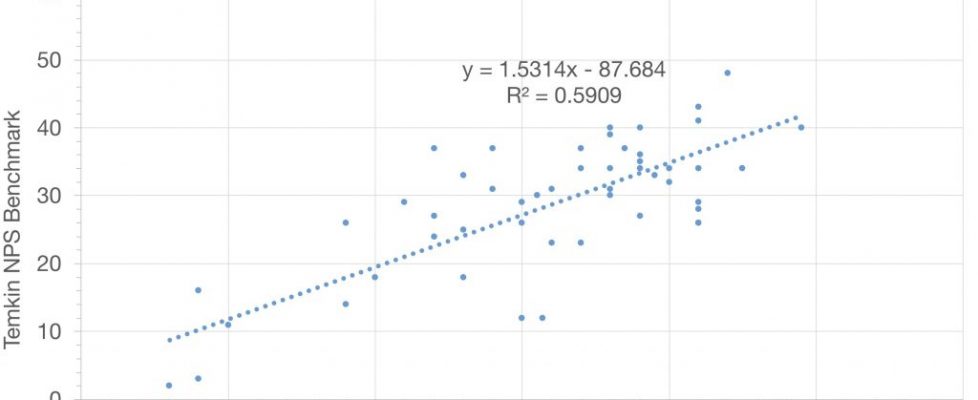
A Swiss business school did a simple NPS survey among its students. Once again, women and men scored quite differently depending on where they lived. Women living at home were far happier than male students living at home (meaning with their parents). This was not expected. It was pure chance that the survey owner decided to look at gender as a factor. The full range of NPS differences by demographic is shown below. Respondents with the attributes towards the top-right gave the highest Net Promoter Scores.

The survey owner used the information to propose a series of actions. For example, the unhappiest students were those who came from countries other than Switzerland or France. The proposal was a specific welcoming process for such students, including free French courses. There was no clear proposal for how to make students living with their parents happier with their lot. If you have ideas, I will pass them on. (Strangely, this was mainly an issue for male Bachelor’s degree students. Or maybe you don’t think it is strange…)
I suppose one other entertaining factoid from this survey is worth mentioning. While the beauty of the campus, with amazing views of the Alps and Lake Geneva was in the top three reasons students liked the school, half as many Swiss people mentioned it as French students. Too blasé, I suppose.
Action orientation
One last point: If you don’t already have the demographic information but it is of no conceivable use in an action plan, please don’t ask. Let’s suppose you want to know what should be improved in your commercial air-conditioning products. Asking the respondents what age they are is of almost no conceivable relevance.
(As is often the case, this blog post is a mildly-edited version of a chapter in one of our books. In this case the book is Customer Experience Strategy – Design and Implementation. All of our books are available in Kindle and print versions from Amazon.)


